


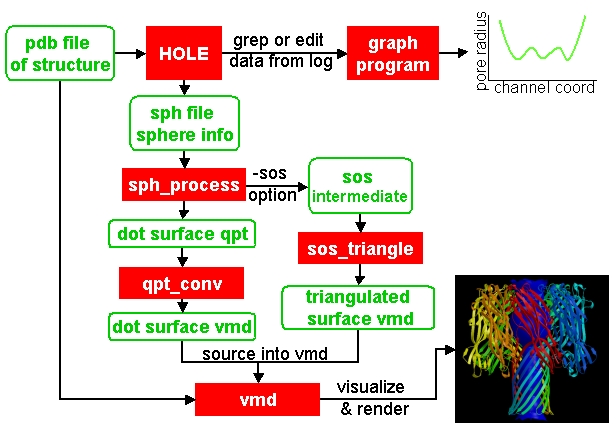
One of the more useful ways to visualize the results of HOLE is to plot a graph (all those school teachers/university demonstrators must have some influence). Raw data which can be used for this purpose is written at the end of the run log (this is normally redirected to a text file). USE OF GREP. This can be edited and read into your favourite graph plotting program (I use and recommend xmgrace).
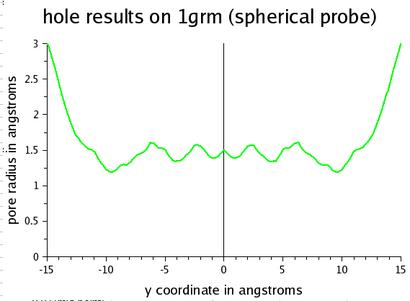
For the abscissa of the graph it is normal to use the 'channel coordinate' - this is dot product of the sphere centre with the channel vector CVECT. If the channel is aligned along an axis, for instant the y axis (channel vector = {0 1 0}, the channel coordinate will simply be the relevant coordinate. An alternative is to use the distance moved along the pore centre-line from the initial point. The former representation, which was suggested by Mark Sansom, is probably preferable as it allows easy comparison between the results of different runs and for the position of important atoms/residues to be marked on the graph. The latter representation gives an indication of the straightness of the pore but comparison between runs is made more difficult by side to side jumps in the centre line.
The pore radius determined should be used for the ordinate of the graph. For the CONN option other information is output. The equivalent radius is the radius of a circle with the same area as that found to be accessible to a Connolly probe sphere on that plane.
The other useful way of visualization of HOLE results is to use molecular graphics.
(In fact it may be useful to combine the two - displaying a graph within
a molecular graphics program - this will be explored in future releases).
4.2 sph_process - a program to produce surface
information from .sph file
This program takes the .sph file, output by the SPHPDB option in the hole program, and processes it into a dot surface. Currently the default output is .qpt - a binary quanta plot file format. This can be converted using the program qpt_conv. (In the future it is intended to change this program so that it directly outputs vmd graphics objects)
For a full list of the options available in sph_process use the -h option on the command line:sph_process -h | moreAn example of its use (with the example 01 application on gramicidin supplied with hole):
sph_process -dotden 15 -color example.sph example.qpt
 *** Program sph_process (replacing sphqpt) ***
 Reads a .sph file produced by hole
 option SPHPDB which contains sphere centre info,
 and processes it to a either dot surface or a number of other options
 either as a dot or grid representation
 Copyright 1996,1997 by Oliver Smart and Birkbeck College
 Copyright 2004 by Oliver Smart
 Program modification number 2.2 001
 HOLE release 2.2.001(static) (Dec 2004)
 Program linked at Fri Dec 10 05:41:36 GMT 2004 by user HOLE_DIST
 For help on hole suite see  http://hole.biop.ox.ac.uk/hole/help

Have opened example.sph for input
        and example.qpt for output
qpt output option used
 (Have read   342 records)
 Outputing centre line to quanta colour 4 (default yellow)
 Outputing low rad surface to quanta colour 3 (default red)
 Outputing mid rad surface to quanta colour 7 (default green)
 Outputing high rad surface to quanta colour 2 (default blue)
This will produce a dot suface that is quite dense. It will be colored so parts that are inaccessible to water (pore radius < 1.15 Å) are red, water accessible parts (1.15 Å > pore radius < 2.30 Å) are green and wide areas (pore radius > 2.30 Å are blue).
For solid surfaces then you should use -sos option to write an intermediate (.sos) file for the sos_triangle program.
sph_process -sos -dotden 15 -color example.sph example.sos
$ qpt_conv
 *** Program qpt_conv ***
 Copyright 1996,1997 by Oliver Smart and Birkbeck College
 Copyright 2004 by Oliver Smart
 Program modification number 2.2 001
 HOLE release 2.2.001(static) (Dec 2004)
 Program linked at Fri Dec 10 05:41:35 GMT 2004 by user HOLE_DIST
 For help on hole suite see  http://hole.biop.ox.ac.uk/hole/help

 This program converts a .qpt file (as produced by hole)
  to something else.
 Output options
 'A' to/from ascii version of original .qpt (can then edit)
 'C' A .qpt file in which dots are replaced by 3D crosses
 'L' A .qpt file with long lines split into smaller sections
       (useful for proper depth queueing in qplot)
 'I' InsightII format
 'R' Rasmol format
 'S' Sybyl format
 'K' to David C. Richardson's kinemage format
 'O' for use with O program
 'V' to Virtual Reality Markup Language
 'D' to VMD format
  Enter conversion option character <stop program>: D

 S/r qptvmd.
   Reads in a hydra/quanta 3D binary plot and writes
   out an VMD equivalent.  To use this file in VMD type:
 source blah.vmd_plot
   at the vmd prompt
 Please enter input binary hydra/quanta plot (old) filename
 defaults <example.qpt> ext:<.qpt> (abort by EXIT or ^D) :
 Please enter vmd format file (new) filename
 defaults <example.vmd_plot> ext:<.vmd_plot> (abort by EXIT or ^D) :
 What width do you want lines to appear <1>:
STOP FORTRAN STOP qpt_conv: normal completion statement executed
Note that everything appearing in triangular braces is a default option - so just
hit return. To use the file produced (example.vmd_plot) in vmd simply type
"source example.vmd_plot" at the vmd> prompt in the vmd console window.
sos_triangle -hThe program is not perfect and can be slow. If you get missing triangles or bad joins in the surface then the best thing is to try adjusting dotden in sph_process.
Example application to gramicidin:
time sos_triangle -s < example.sos > example.vmd_triThe process is quite slow (around 20 secs on a 1Ghz processor). To use the file produced (example.vmd_plot) in vmd simply type "source example.vmd_tri" at the vmd> prompt in the vmd console window.